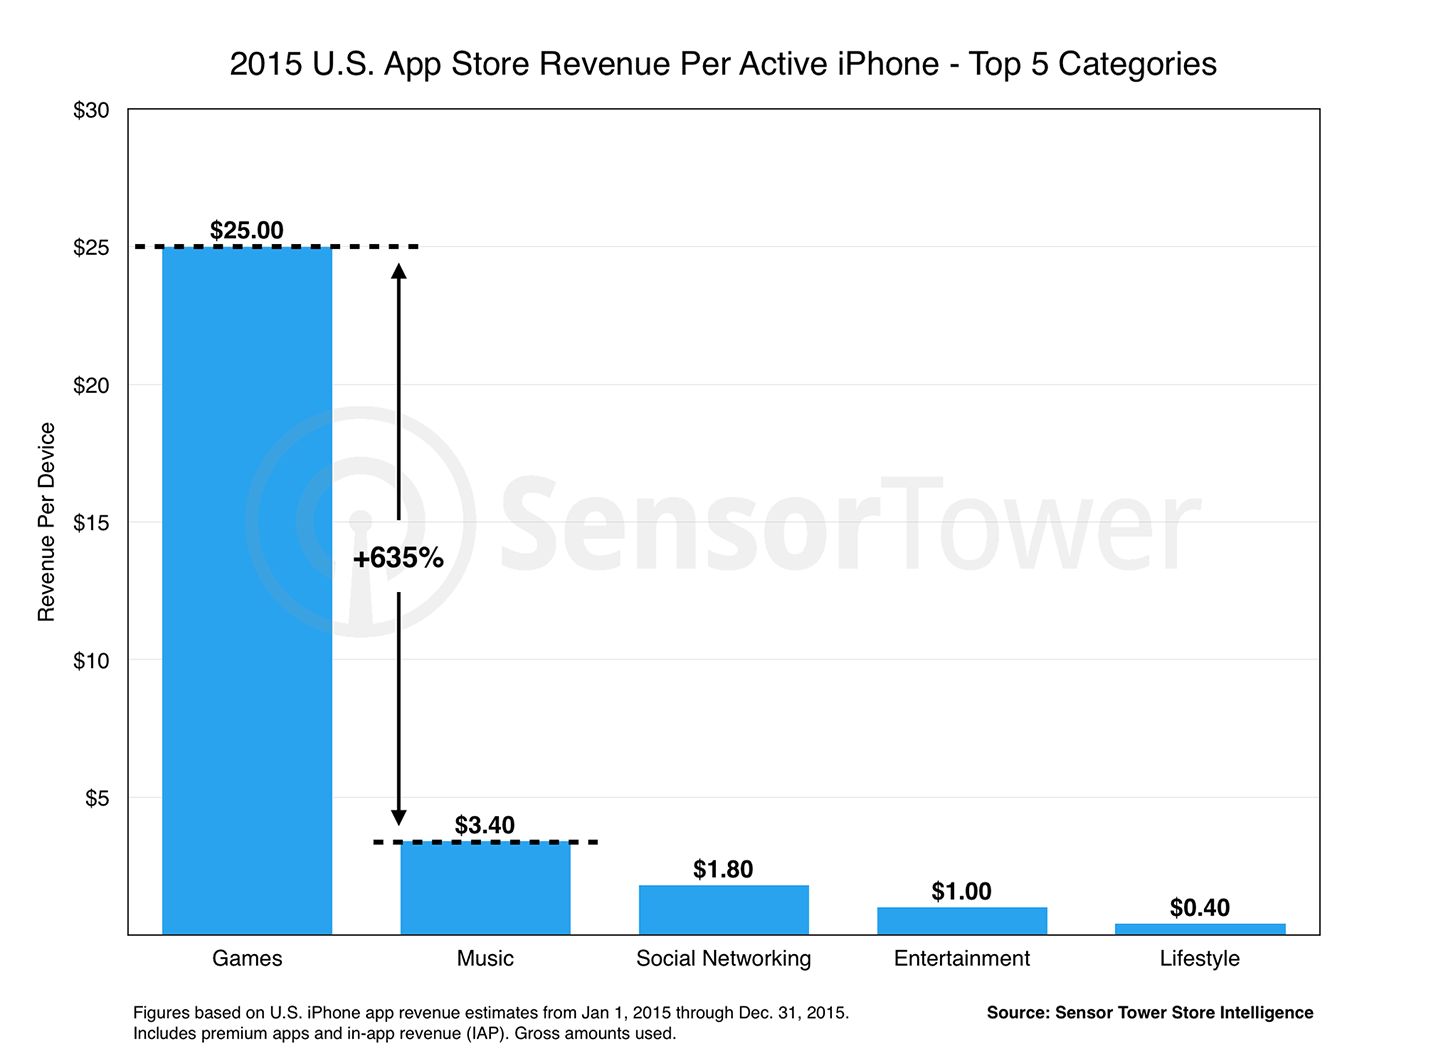
App marketing company, Sensor Tower revealed the results of a study it made regarding the amount U.S. iPhone users spend on apps. Based on the data they gathered, they came to the conclusion that $35 is the average that mobile consumers spent on apps. This covers both premium downloads and in-app purchases.
How did Sensor Tower get this data?
They looked at the active iPhone devices (estimated to be at 110 million) in the United States for calendar year 2015 (January 1 through December 31).
Here are some charts breaking stats nerds will love.
Related: 3 Apps for a Healthier You in 2016 – Guaranteed!
To be clear, though, Sensor Tower emphasizes that the numbers shown are gross revenues, still including the 30% cut that Apple gets for every purchase. The amounts are also not inclusive of taxes.
Now, on to the numbers.
Average Revenue Per Active iPhone

Surprise, surprise! People bought games more than any other type of app. It’s pretty amazing, though, how $25 of the $35 spent goes to games, isn’t it?
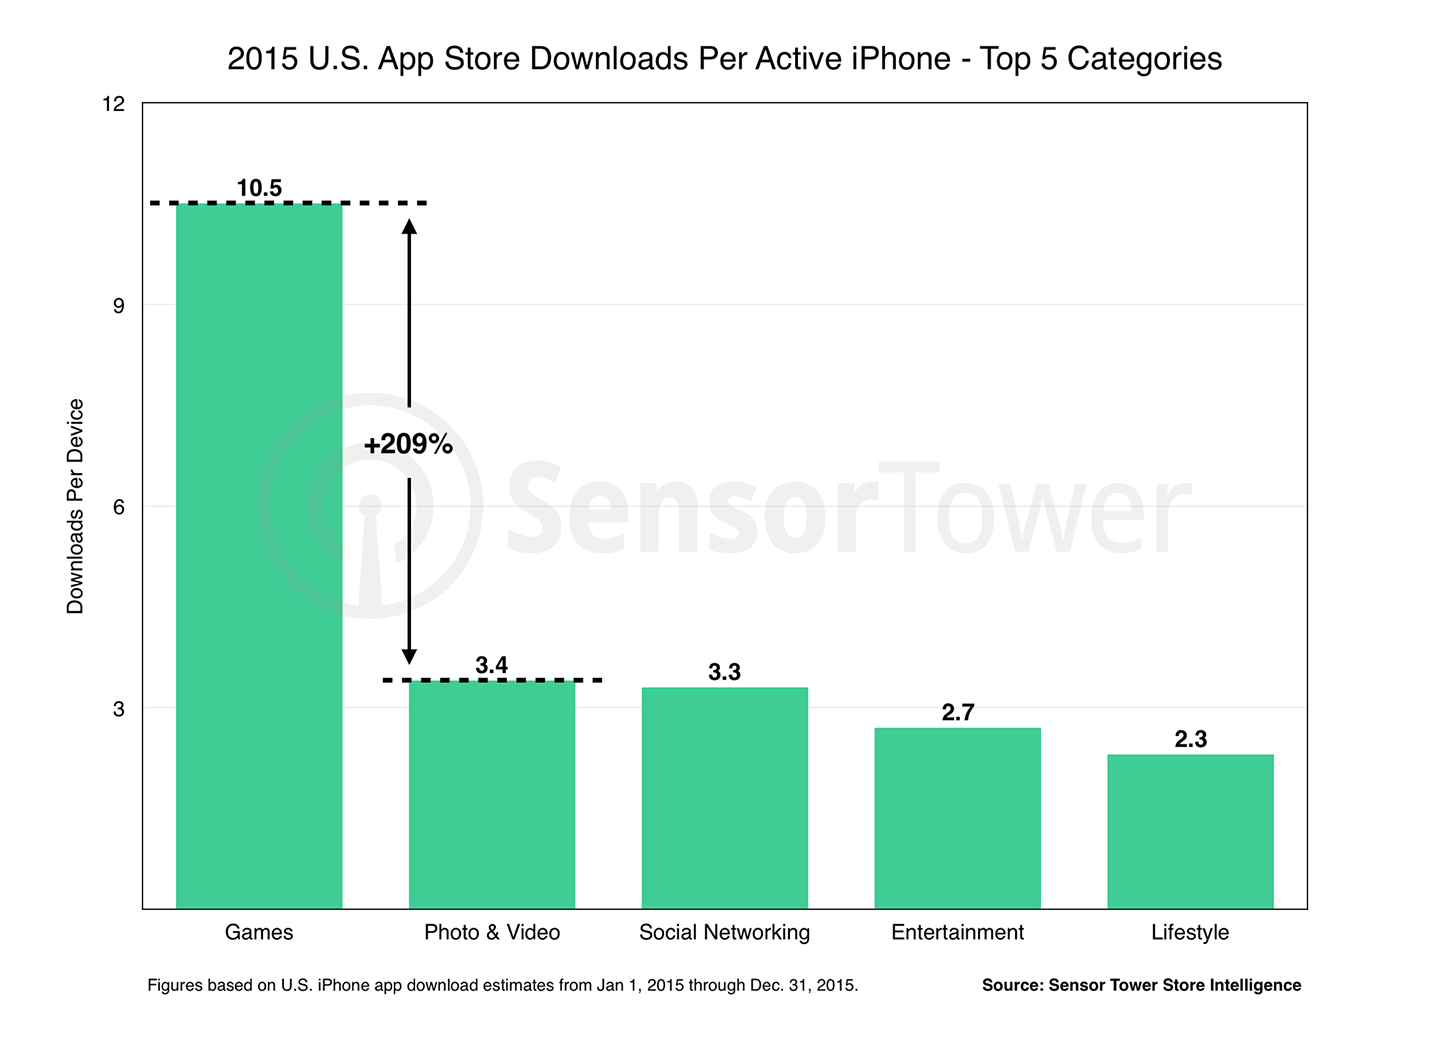
Average App Installs Per Active iPhone

Given the previous graph, this second visual is but to be expected.
So, have you ever calculated how much you spent on iOS apps last year? Or even in a month? If you’re a Clash of Clans or Game of War player, do you keep track of your in-app purchases? Same goes for every other game out there that offer in-app purchases, actually.
Is your iOS app spending below or above average?


