
Activity Monitor does what it sounds like: it monitors the activity on your Mac, keeping track of the system resources that Mac apps are using. It’s a lot like Windows’ Task Manager, revealing all the apps and system processes that are currently running. You might have used Activity Monitor to force quit apps in the past, but the utility capable of more than just killing apps.
What Is Activity Monitor?
To launch Activity Monitor, type the application’s name into Spotlight or Launchpad. You can also find the application at Applications/Utilities/Activity Monitor.app.
In the default view, Activity Monitor provides a table of all the currently-running applications and the amount of CPU “space” they’re taking up. It doesn’t just show user applications either – you’ll also see system processes and daemons.
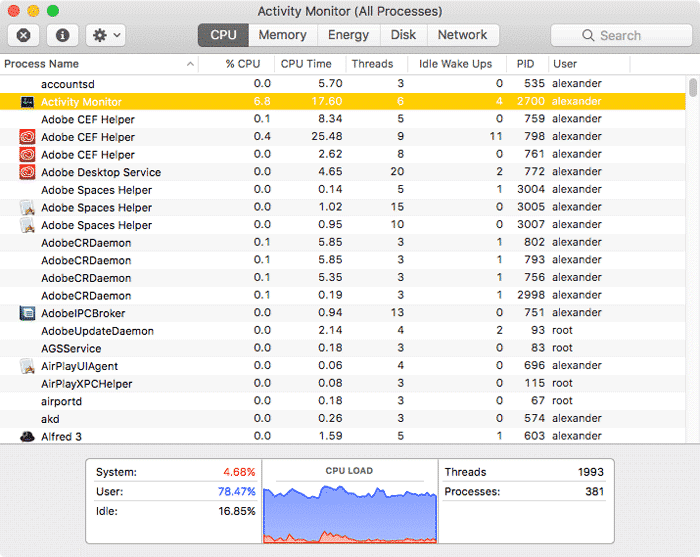
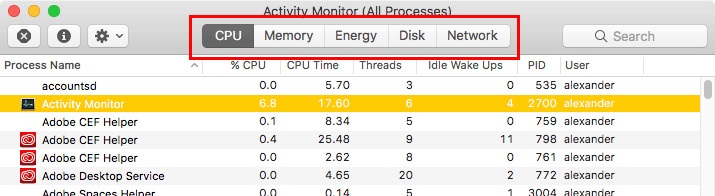
There are five tabs at the top of the window: CPU, Memory, Energy, Disk and Network. Each of these tabs show data about that particular resource, and how much of it the app is using. Click on each category to see how much of a given resource all running processes are using.
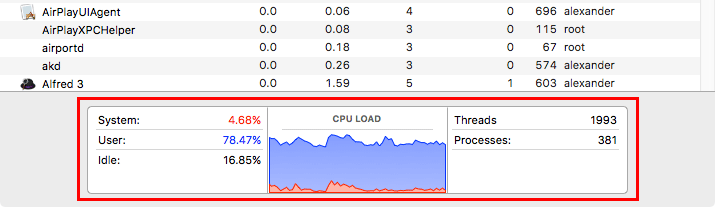
At the bottom of the window, you’ll find a graph with some high level data. This summary-level view is useful for quickly getting a handle on how much of your system is currently occupied. For example, under the CPU tab, you’ll see a graph showing the percentage of CPU power that system and user processes are using, along with a graph showing the same data. The graph and summary data changes contextually as you click on different tabs.
Force-Quitting Applications
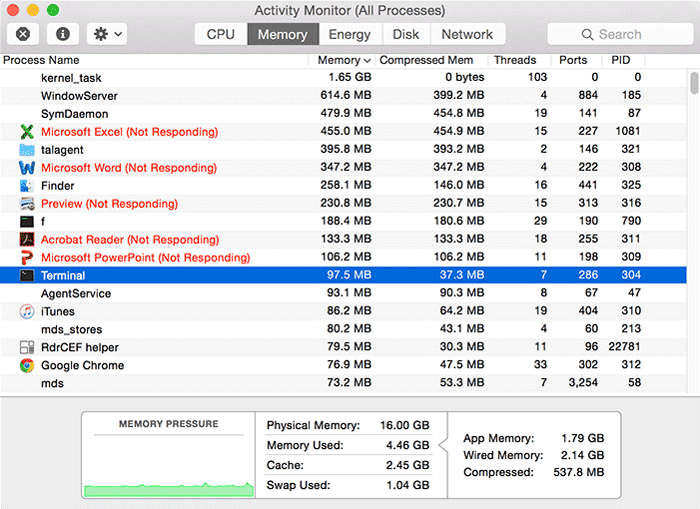
When applications stop responding to your input, you’ll sometimes need to force them to close. You can do this by right-clicking in the Dock, but Activity Monitor can give you more information about what other apps have crashed, if any. Since Activity Monitor lets you see everything that’s currently running, it makes it easy to quickly identify applications that have hung or crashed and need to be put out of their misery. In any Activity Monitor tab, hung applications’ names will turn red. You’ll also see “Not Responding” appear in parentheses. When you see that, you know you’ll need to force quit an application.
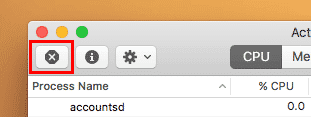
To force an application to close, click on its name. Then click the force quit icon in the upper left, which looks like a stop sign with an X through it.
Sorting Data to Find CPU Hogs
Like any table in macOS, you can sort by data by columns in Activity Monitor. For example, clicking “% CPU” will sort applications by the percentage of the CPU’s capacity that they’re using.
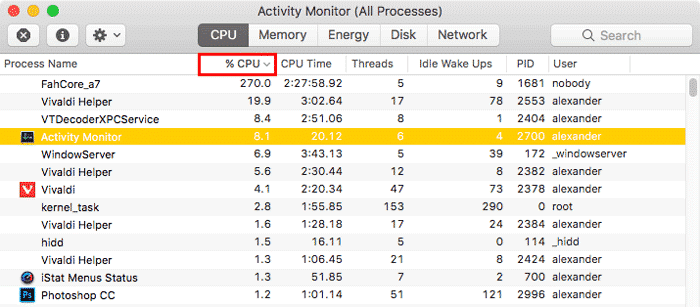
You’ll quickly see which apps are using the lion’s share of your CPU’s capability. If your fans suddenly started spinning, looking at CPU-heavy apps will help you nail down the culprit.
Note that sometimes you’ll see apps using more than 100 percent of the CPU, or notice that all these numbers add up to more than 100 percent. This happens on systems with multi-core CPUs, since each core is considered 100 percent. That means a four-core processor technically has 400 percent processing capacity available.
Do You Need More RAM?
While Macs no longer allow users to upgrade their RAM, you can still use Activity Monitor to find out if you need more. This helps when buying a new Mac: you’ll know if you need more memory than you currently have, or confirm that the existing allotment is enough.
First, figure out all the apps you typically have open while you’re using your Mac. Then open Activity Monitor and Click the “Memory” tab up top.
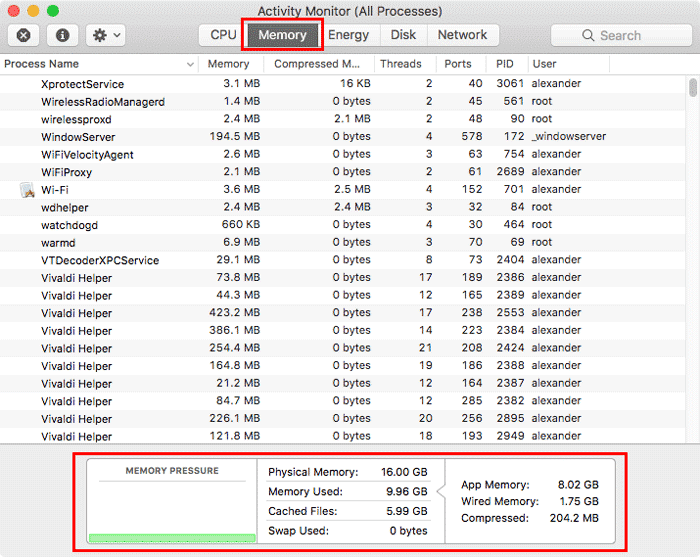
Take a look at the graph on the bottom labelled “Memory Pressure.” Under light load, that graph will be green, indicating you have enough memory to get the job done. If that’s orange or red in places, that’s an indication that you need more memory than you currently have.
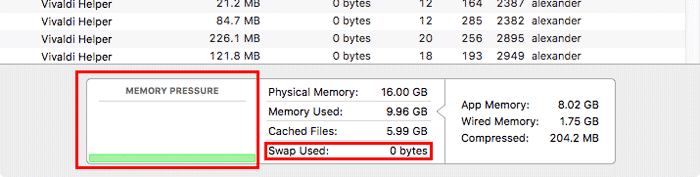
For confirmation, take a look at the “Swap Used” field at the bottom of the middle column. If you have plenty of memory, that number should be at or very close to zero bytes. However, if it’s a high number, that means your computer is regularly “swapping” information from fast memory to slow hard disk storage. This can slow down your system significantly, and it means you don’t have enough RAM to support your current workflow.
Quitting Memory Hogs
Activity Monitor can also quit RAM-hogging applications to help free up your system’s resources. Click the “Memory” column to sort by the most memory-intensive applications. Once you have the list sorted, you can start closing applications that take up a ton of memory.
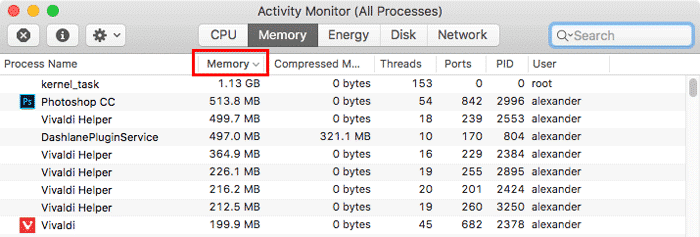
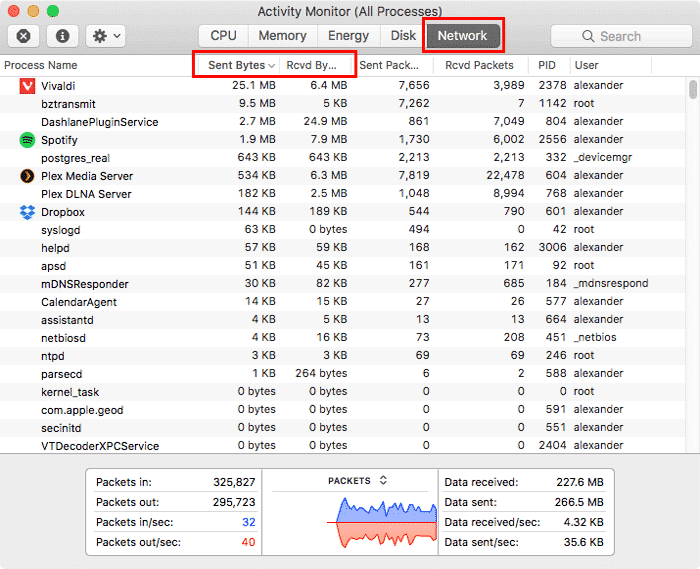
Figure Out Which App Is Using Your Bandwidth
You can also use Activity Monitor to reveal apps using significant Internet bandwidth. If your connection has suddenly slowed, this might help get you back up to speed. Click the “Network” tab to reveal a table showing how much communicating each of your applications is doing. You can sort by “Sent Bytes” or “Received Bytes” to see which apps have been the most active.
You might also like:
Troubleshoot Mac Issues with Console
Find Out What App Is Using Your Webcam on Your Mac
Understanding and Troubleshooting with Network Utility